# HTML is All You Need (for Agents to Make Graphics)
Amol Kapoor, Nori Agentic
AI Engineer World's Fair 2026
[Talk page](https://ai.engineer/talks/JRTAtZ5iBkU-html-is-all-you-need-agents-make) · [Video](https://www.youtube.com/watch?v=JRTAtZ5iBkU)
## HTML Is All You Need for Agents to Make Graphics
A coding agent can make slides, documents, and video when it authors structure in HTML and CSS and lets the browser turn that structure into pixels.
Basic familiarity with HTML elements and CSS will help with the layout example; no agent framework experience is required.
### Can a coding agent make your next slide deck?
[0:06](https://www.youtube.com/watch?v=JRTAtZ5iBkU&t=6s)
Can a coding agent make slides, documents, or even video? The name suggests a tool for software development, but the underlying capability is broader: an agent can work with structured text to produce artifacts that are not themselves software products. Amol Kapoor, introducing himself as CEO of Nori Agentic, starts from an AI employee with access to company code, documents, Slack, and other data. Making visual artifacts becomes another application of that capability—provided the agent gets a representation it can work with.
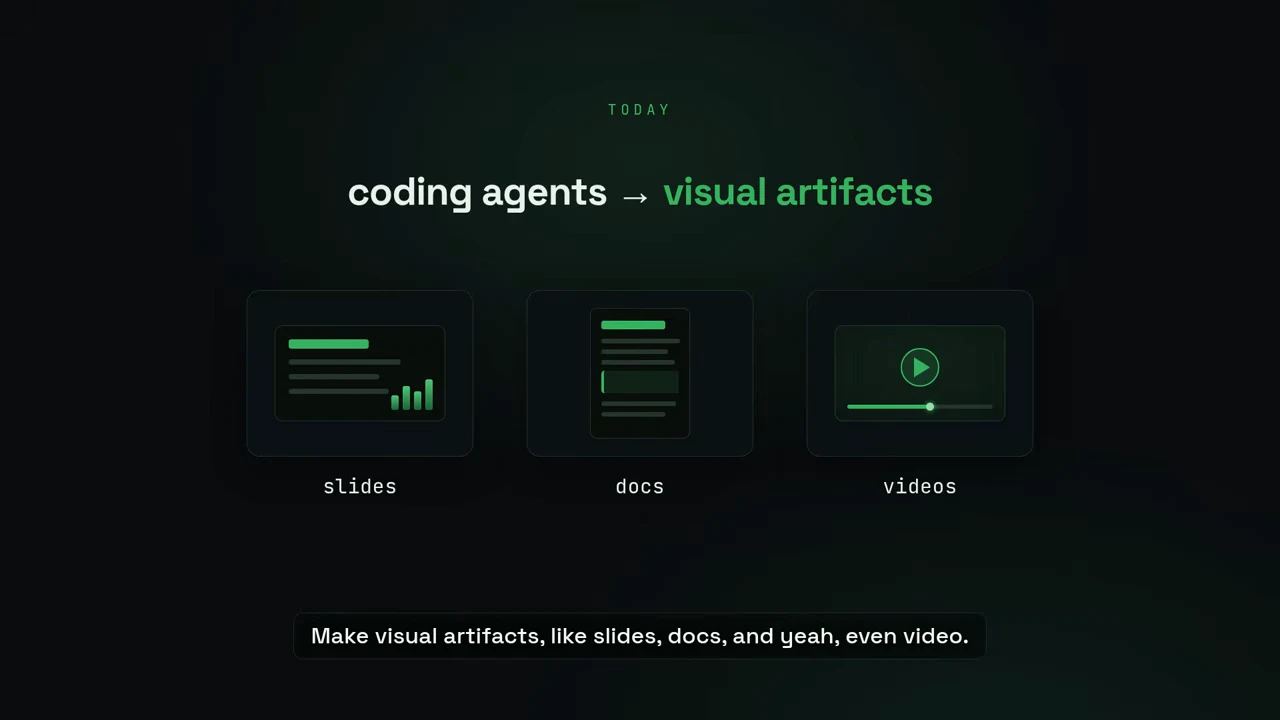
Coding agents can create visual artifacts: slides, docs, and videos.
### The work hidden inside a slide
[0:59](https://www.youtube.com/watch?v=JRTAtZ5iBkU&t=59s)
A slide deck contains two kinds of work: deciding what to say and getting everything into place. Kapoor estimates that slide creation consumes roughly 34,000 human years every day. That is an extrapolation, not a measured total. He contrasts a ten-hour deck with about twenty-five minutes once formatting, branding, and repositioning are removed; his [companion article](https://www.usenori.ai/newsletter/2026-03-31-coding-agents-powerpoints.html) describes the shorter figure as active human work, rather than elapsed generation time. The useful distinction is between developing the story and spending hours adjusting its presentation.
Open PowerPoint, Slides, Figma, or Canva, and the default workflow is a canvas. You click, drag, drop, resize, and snap objects to a grid. These interactions fit human hands and spatial perception. An application-specific data structure sits underneath, but the visible editing interface asks you to manipulate objects in space.
Give an agent that workflow and the failure modes are familiar: overlapping objects, unreadable text, and missing alignment. Kapoor connects those failures to skepticism about agents’ spatial reasoning and invokes [ARC-AGI](https://arcprize.org/arc-agi). ARC-AGI more broadly evaluates generalization and skill acquisition; it is not founded on the premise that agents cannot reason about space. The narrower question here is whether a poor layout reveals a limit of the model or a mismatch in the interface it was given.
### A pelican, a bicycle, and a wall of numbers
[2:10](https://www.youtube.com/watch?v=JRTAtZ5iBkU&t=130s)
[Simon Willison’s pelican exercise](https://simonwillison.net/tags/pelican-riding-a-bicycle/) makes the representation problem concrete: ask a model to draw a pelican riding a bicycle, using only SVG. The task requires recognizable objects and a plausible spatial relationship between them. Kapoor shows examples he considers poor, then questions whether that establishes that agents are hopeless at graphics.
Try the same constraint on a person: handwrite an SVG of a pelican. The person may know exactly what the bird looks like yet struggle to express it as numeric geometry. Kapoor describes that source as a wall of numbers. Humans usually solve the problem by drawing on a canvas, where they can see and manipulate the shapes directly. The representation makes a large difference to how easily a visual idea becomes an artifact.
Figma MCPs, PowerPoint CLIs, and screenshot-and-replace loops expose different interfaces, but Kapoor groups them together because they retain a workflow organized around the human canvas. His analogy reverses the pelican problem: asking an AI to manipulate a canvas resembles asking a human to write SVG by hand. **Choose the authoring language around the agent’s strengths:** words, structure, and relationships rather than repeated pixel-level manipulation.
### Write structure; let the browser lay it out
[3:37](https://www.youtube.com/watch?v=JRTAtZ5iBkU&t=217s)
The desired medium already exists: **HTML**, styled with **CSS**. It is text, describes structured content, and renders through a widely available browser. Kapoor says models have encountered billions of examples of this language in training, though he supplies no model-specific corpus count. His practical point is familiarity: web markup gives an agent an established vocabulary for expressing a visual artifact.
HTML supplies elements and document structure; CSS supplies layout and styling. A heading can be an `h1`, a group of panels can live in a grid, and chart elements can be styled inside that structure. The browser computes the resulting pixels. Kapoor describes this as avoiding coordinate placement: the useful mechanism is that the agent can specify relationships instead of manually positioning every object. [CSS Grid](https://developer.mozilla.org/en-US/docs/Web/CSS/Guides/Grid_layout/Basic_concepts), for example, can automatically place children into tracks. It still requires layout decisions, and poorly chosen sizing can still cause overflow or overlap.
A small slide illustrates that division of responsibility. The source below asks for a heading and two equal-width panels. It specifies spacing and typography but never computes the panels’ screen coordinates.
```html
Q3 Results
Q3 Results
Progress
Summarize the quarter's completed work.
Next steps
Explain the decisions needed for the next quarter.
```
The same browser platform supports fonts, charts, richer layouts, and motion. The recording’s code-to-render diagram makes that handoff visible: HTML passes through the browser into a Q3 Results panel with a grid and four green bars.
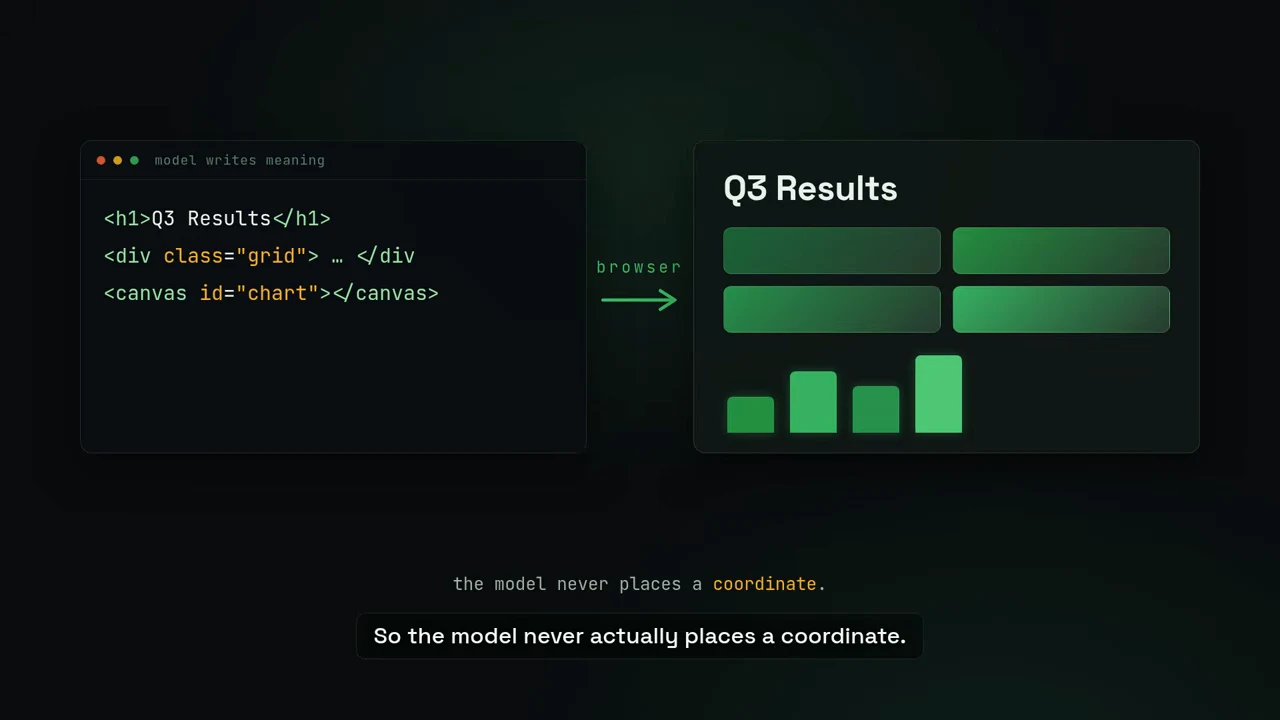
HTML structure becomes a visual layout through the browser.
Kapoor then returns to the pelican riding a bicycle, this time asking for HTML. The intended advantage is an artifact whose structure the model can manipulate and whose source a person can read, theme, and edit line by line. The demonstration does not identify the models or settings needed to establish a controlled HTML-versus-SVG comparison; it illustrates the proposed change in authoring medium.
### A deck is not its editing tool
[4:34](https://www.youtube.com/watch?v=JRTAtZ5iBkU&t=274s)
Years of making decks in PowerPoint can make the tool and the artifact feel synonymous. But PowerPoint is an authoring environment; the audience sees the presentation. That separation lets the workflow choose an editing format suited to the agent without requiring the audience to care how the deck was produced.
Keep HTML as the editable source, then render to another format such as PDF when distribution requires it.
| Layer | Responsibility |
|---|---|
| HTML and CSS | Editable content, layout, and theme |
| Browser presentation | Visual result the audience sees |
| PDF export | A separate format for sharing |
**The authoring format and the delivery format do not have to match.** Changing the former need not change the purpose of the finished deck.
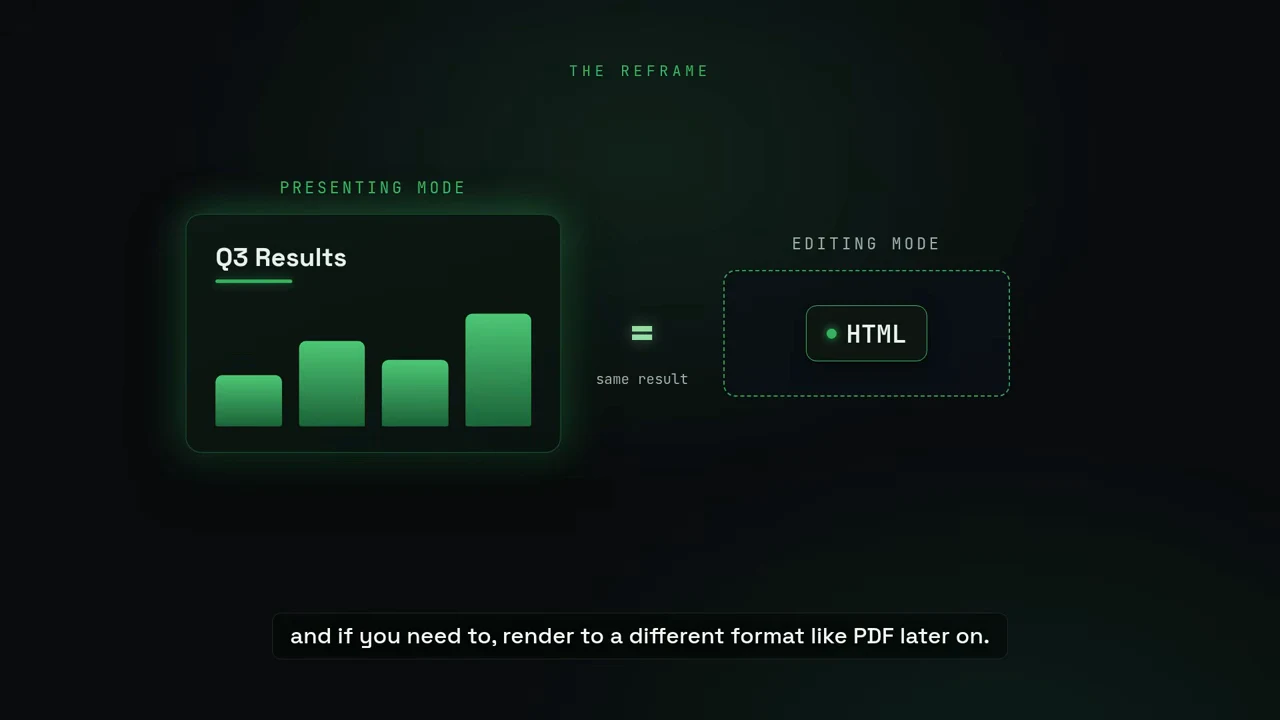
An HTML editing format produces the same presentation result.
### The same source medium reaches beyond slides
[5:11](https://www.youtube.com/watch?v=JRTAtZ5iBkU&t=311s)
Kapoor reports using this approach for the company’s routinely presented and shared slide decks, including board decks and sales decks. Documents use the same approach to add color and visual structure while following the company brand. The recording itself extends the example to video: Kapoor describes its visuals as HTML and CSS, “divs all the way down.” The accompanying browser illustration shows the talk beside an Elements pane containing nested `div` elements.
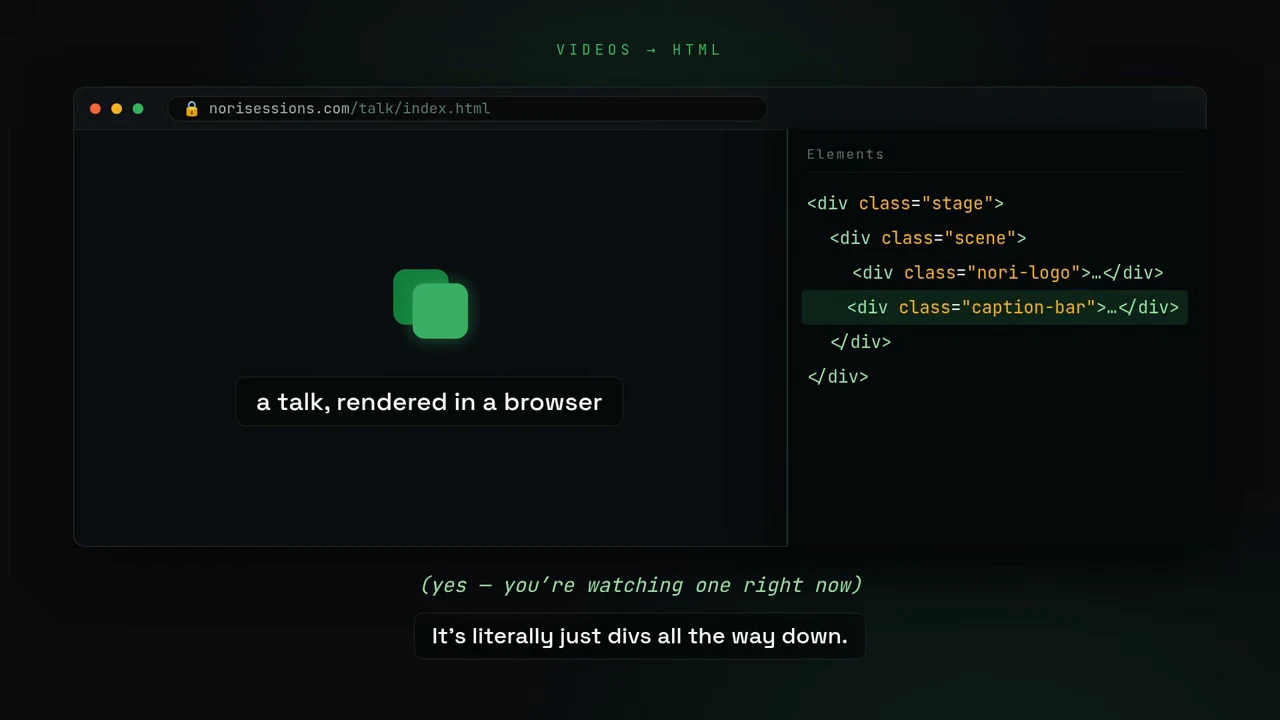
A talk rendered in a browser, with its HTML structure alongside it.
The broader design choice is whether plain text is enough for the intended use. Kapoor favors adding structure and color when they make an artifact more useful, rather than accepting plain text simply because it is convenient to generate. HTML gives an agent a way to make that choice without moving into a separate canvas-editing workflow.
### The deck still needs something to say
[5:53](https://www.youtube.com/watch?v=JRTAtZ5iBkU&t=353s)
A beautiful deck has little value without substantive content. Once the agent can handle presentation, the next requirement is access to the material that belongs in it. Call transcripts and emails are Kapoor’s examples: give the model access to those inputs, and it can assemble content as well as generate the visual artifact.
That leaves the human focused on vision and story while the agent handles the assembly work. Kapoor presents [Nori Sessions](https://noriagentic.com/) as the product that connects those capabilities, and reports building entire board decks from his phone during a subway commute. He attributes that workflow to a bot embedded in company context and says Nori supplies the capabilities needed to make it work. The content access is essential to the pitch: HTML provides a medium for presentation, while company knowledge supplies what the presentation is about.
The closing instruction is to design from the model’s working medium: “Stop thinking like a user. Think like the model.” For graphics, Kapoor’s answer is HTML—a language the agent can edit as structure and the browser can turn into something an audience can see.
## Resources
- [How Kapoor makes slide decks with coding agents](https://www.usenori.ai/newsletter/2026-03-31-coding-agents-powerpoints.html) — Kapoor's workflow combines company context, HTML/CSS slides, recorded feedback, agent revisions and PDF export.
- [Simon Willison's SVG pelican exercise](https://simonwillison.net/tags/pelican-riding-a-bicycle/) — Willison's collection of model-generated SVG pelicans riding bicycles.
- [What ARC-AGI measures](https://arcprize.org/arc-agi) — The benchmark's official explanation of generalization, skill acquisition and core knowledge priors.
- [On the Measure of Intelligence](https://arxiv.org/abs/1911.01547) — François Chollet's original framework for measuring intelligence and introducing ARC.
- [CSS Grid layout fundamentals](https://developer.mozilla.org/en-US/docs/Web/CSS/Guides/Grid_layout/Basic_concepts) — Practical examples of browser-managed rows, columns, sizing, alignment and automatic placement.
- [Nori Sessions](https://noriagentic.com/) — Nori's current product overview for cloud agents with organizational context and integrations.
## Slides
### Made with Claude Code
The opening credits Claude Code with making the video, then crosses out “single shot” and acknowledges a little editing.
[0:01](https://www.youtube.com/watch?v=JRTAtZ5iBkU&t=1s) [Text says the video was made by Claude Code, with “single shot” crossed out and a note acknowledging some editing.](https://assets.ai.engineer/sites/aiecode2025/sha256/1267232dc106ee20b36383c078f3cdac62f0e917eb028f1727c1265a19ea5382.webp)
This whole video was made by Claude Code.
In a single shot.
* okay — there was a little editing.
### Introducing Amol
Amol, CEO of Nori Agentic, introduces an AI employee that understands company code, docs, Slack and other data. The diagram connects those sources around a central node.
[0:15](https://www.youtube.com/watch?v=JRTAtZ5iBkU&t=15s) [Amol introduces himself beneath a diagram connecting code, docs, data and Slack.](https://assets.ai.engineer/sites/aiecode2025/sha256/387b55b8c76411b7182aade9d24ae2bd080bbe821e7bb8856a59d1ab63cba680.webp)
AMOL · CEO, NORI AGENTIC
docs
code
data
slack
Hi — I’m Amol.
We spend a lot of time thinking about how coding agents really work.
### What coding agents can create
Amol challenges the idea that coding agents only write code, mapping one agent to outputs from slides and charts to websites and dashboards. Getting the result you want, he says, requires thinking like an agent.
[0:39](https://www.youtube.com/watch?v=JRTAtZ5iBkU&t=39s) [A coding agent connects to slides, docs, charts, email, video, sheets, websites, diagrams and dashboards.](https://assets.ai.engineer/sites/aiecode2025/sha256/790d0500e420260ca89152b8e57202731913152980c601d2090fe238b686d1a8.webp)
agents can ONLY write code
>_ CODING AGENT
slides
docs
charts
email
video
sheets
websites
diagrams
dashboards
You have to be able to think like an agent to get it to do what you want it to do.
### Coding agents and visual artifacts
The talk explores using coding agents to make visual artifacts: slides, documents, and videos like this one.
[0:45](https://www.youtube.com/watch?v=JRTAtZ5iBkU&t=45s) [Icons illustrate slides, documents and videos as visual artifacts made with coding agents.](https://assets.ai.engineer/sites/aiecode2025/sha256/f55a517851c6b1a1d04ad75f1408ad363d8606643bbe2b35b1245c5768b34c0e.webp)
TODAY
coding agents → visual artifacts
slides
docs
videos
(like this one)
Make visual artifacts, like slides, docs, and yeah, even video.
### The real cost: fiddling
The speaker argues that much of slide-making time goes into formatting chores: aligning boxes, nudging text, recoloring charts, and fixing templates.
[1:06](https://www.youtube.com/watch?v=JRTAtZ5iBkU&t=66s) [The slide lists aligning boxes, nudging text, recoloring charts and fixing the template as fiddling.](https://assets.ai.engineer/sites/aiecode2025/sha256/66e17b396310f3135236394fc62648dace8c991077327dc1c3d5b497686a5c7c.webp)
THE REAL COST
Not the ideas — the fiddling.
aligning boxes
nudging text
recoloring charts
fixing the template
### The same deck: time comparison
The speaker estimates that a 10-hour deck should take 25 minutes without formatting, branding, and moving elements around—a 24× speedup.
[1:12](https://www.youtube.com/watch?v=JRTAtZ5iBkU&t=72s) [A bar chart compares 10 hours with 25 minutes for the same deck, labeled 24 times faster.](https://assets.ai.engineer/sites/aiecode2025/sha256/2d2022f5a75651a95054e394987f32c3ac82a4812702089a55dc8ab6ed25ffed.webp)
THE REAL COST
THE SAME DECK
10 hrs
25 min
↓ 24× faster
you remove all the formatting and the branding and the moving things around.
### Manipulating a canvas
A cursor sits over a canvas with a rectangle and bar chart, illustrating the click, drag and resize gestures used to build a slide.
[1:24](https://www.youtube.com/watch?v=JRTAtZ5iBkU&t=84s) [A cursor hovers over a canvas containing a rectangle and bar chart.](https://assets.ai.engineer/sites/aiecode2025/sha256/42adb365233175c0a9e63f07f573c3ec424a7ce7914c250dbd808c6c8548a1cc.webp)
and then you start manipulating a canvas.
### The skeptic’s case
Skeptics argue that agents cannot reason about space. An ARC-AGI illustration flips a diagonal of colored squares and adds a green square to the output.
[2:04](https://www.youtube.com/watch?v=JRTAtZ5iBkU&t=124s) [A quote questions agents’ spatial reasoning above colored input and output grids labeled ARC-AGI.](https://assets.ai.engineer/sites/aiecode2025/sha256/1b02c0590d67190e87d8cb6ec1d4b083a69436726d2d07b69f15342268890309.webp)
THE SKEPTIC'S CASE
“Sure — but agents can’t actually reason about space.”
ARC-AGI
INPUT → OUTPUT
and there are whole benchmarks like ARC-AGI that are built exactly around that premise.
### A famous little test
Simon Willison asks models to draw a pelican riding a bicycle using SVG, a quick gut check for spatial reasoning.
[2:13](https://www.youtube.com/watch?v=JRTAtZ5iBkU&t=133s) [A Simon Willison profile appears beside a prompt to generate an SVG of a pelican riding a bicycle.](https://assets.ai.engineer/sites/aiecode2025/sha256/e352f1ef0e04bf122dc31c4e6f403b936b6d23cb1cdb4d7a799c172897af12b5.webp)
A FAMOUS LITTLE TEST
SW
Simon Willison
developer · creator of django
> Generate an SVG of a pelican riding a bicycle.
Can you draw a pelican riding a bicycle?
### Pelican test results
Three models produce rough SVG drawings for the pelican-on-a-bicycle test. The speaker calls the results “genuinely, deeply, really bad.”
[2:30](https://www.youtube.com/watch?v=JRTAtZ5iBkU&t=150s) [Three labeled cards show rough pelican-on-bicycle drawings from different models.](https://assets.ai.engineer/sites/aiecode2025/sha256/c854ea218f6246bfee47ce4207dc45cc4edaa340157962520408a52e2ab23c15.webp)
> Draw a pelican riding a bicycle.
gpt-4o-mini
gemini-1.5-flash
claude-3-opus
Like genuinely, deeply, really bad.
### Why the medium matters
The speaker argues that hand-writing SVG coordinates makes drawing a pelican hard for humans too, suggesting the medium helps explain the models’ poor results.
[2:46](https://www.youtube.com/watch?v=JRTAtZ5iBkU&t=166s) [A person icon faces SVG coordinates overlaid by a question mark.](https://assets.ai.engineer/sites/aiecode2025/sha256/caed435689eeeb417a71d8089ee3f9ec5fc07fbcc1fd6dffefd0bd3ac9d2e5cd.webp)
BUT WHY, THOUGH?
M 312.4 88.1 C 290.1 71.2 118.7 44.0
L 190.0 48.0 q 18 14 30 2 Z
c -3.2 12.6 8.1 19.4 [illegible] 7.7
M 56 128 a 30 30 0 1 0 [illegible] 0
L 105 80 150 128 102 [illegible] 168 70
C 0.882 0.41 0.13 0.77 0.55 0.21
M 134 35 l 0.001 0.001
q 88.7 312.4 71.2 290.1 144 56
M 100 84 104 122 z
If you ask me, it’s not the model, it’s the medium.
### Why the medium matters
The speaker argues that hand-writing an SVG pelican would be hard for a person too: the coordinates look like a wall of numbers, making the image difficult to picture.
[2:50](https://www.youtube.com/watch?v=JRTAtZ5iBkU&t=170s) [A person icon faces SVG coordinates overlaid with a sketch of a pelican riding a bicycle.](https://assets.ai.engineer/sites/aiecode2025/sha256/eec2dbec89bde12ef22356b94c88d4f4cf0ea4f86c44e70a821e6770945a1b92.webp)
BUT WHY, THOUGH?
L 190.0 48.0 q 18 14 30 2 Z
c -3.2 12.6 8.1 19.4 22.0 17.7
M 56 128 a 30 30 0 1 0 60 0
L 105 80 150 128 102 60 168 70
C 0.882 0.41 0.13 0.77 0.55 0.21
M 134 35 l 0.001 0.001
q 88.7 312.4 71.2 290.1 144 56
M 100 84 104 122 z
If I asked you, someone who is presumably human, to hand-write an SVG of a pelican,
[2:55](https://www.youtube.com/watch?v=JRTAtZ5iBkU&t=175s) [A person faces a panel of SVG numbers overlaid with a question mark.](https://assets.ai.engineer/sites/aiecode2025/sha256/73a8d0481c80ebd13e3e63234dbebb02d4e74e56ea03b54fb3423247c6c98911.webp)
BUT WHY, THOUGH?
L 190.0 48.0 q 18 14 30 2 Z
c -3.2 12.6 8.1 19.4 22.0 17.7
M 56 128 a 30 30 0 1 0 [illegible] 0
L 105 80 150 128 102 [illegible] 70
C 0.882 0.41 0.13 [illegible] 0.21
M 134 35 l 0.001 0.001
q 88.7 312.4 71.2 290.1 144 56
M 100 84 104 122 z
SVGs are just a wall of numbers.
### Thinking graphically
A person imagines a landscape, illustrating the speaker’s point that people think graphically and build tools to draw on a canvas.
[3:05](https://www.youtube.com/watch?v=JRTAtZ5iBkU&t=185s) [A person imagines a simple landscape in a thought bubble.](https://assets.ai.engineer/sites/aiecode2025/sha256/8a4bf4ceddc3d8ad7df277eb7eeb489e4103501150de7dd5adc0d7a29ba4f470.webp)
BUT WHY, THOUGH?
We think graphically, so we built tools that let us draw on a canvas.
### The workarounds
The speaker groups five agent workflows around a common problem: they approach graphics like a human. He argues that asking AI to use a canvas is like asking a person to write SVG by hand.
[3:18](https://www.youtube.com/watch?v=JRTAtZ5iBkU&t=198s) [An agent connects to five approaches, with a note that they all think like a human.](https://assets.ai.engineer/sites/aiecode2025/sha256/1b978ba8b2ca95c24d61de60cf6395b5ae455ba3799c74915399920ca87bf068.webp)
THE WORKAROUNDS
vision re-prompt
Figma MCP
PowerPoint CLI
>_ AGENT
screenshot → replace
pixel-diff eval
↑ all think like a human
They all approach the problem like a human.
### An AI isn't human
The speaker argues that agents need tools expressed in language. The diagram surrounds an agent with words, structure, and markup to illustrate that medium.
[3:34](https://www.youtube.com/watch?v=JRTAtZ5iBkU&t=214s) [An agent is surrounded by words and markup such as heading, structure, grid and tag.](https://assets.ai.engineer/sites/aiecode2025/sha256/993a7053d063fa3462c92bb7d4ed45d3a65a83546173cd7077c564a57c0605ac.webp)
BUT AN AI ISN'T HUMAN
verb
heading
structure
noun
>_ AGENT
list
grid
"label"
token
You need to give the AI tools based on how it thinks, not in pixels, in language.
### Imagine a language that...
The speaker frames HTML as a language models know from training that describes layout, renders to pixels, and runs widely.
[3:42](https://www.youtube.com/watch?v=JRTAtZ5iBkU&t=222s) [A checklist describes a language for visual layout with abundant training data that models understand intuitively.](https://assets.ai.engineer/sites/aiecode2025/sha256/19ee40cc4487017bed519b4f183fbcf51302693ec646382692b94074092e4d10.webp)
Imagine a language that...
✓ describes visual layout
✓ has mountains of training data
✓ models understand it intuitively
Imagine a language that’s incredible at describing layout, that models have seen and trained on billions of examples of,
[3:49](https://www.youtube.com/watch?v=JRTAtZ5iBkU&t=229s) [Five checked properties describe a language that handles layout, renders to pixels, and runs widely.](https://assets.ai.engineer/sites/aiecode2025/sha256/a861e1b97e3ddf4e9bf0fdbc0746ed123a31ad28c71766d630a101dfc2c75f20.webp)
Imagine a language that...
✓ describes visual layout
✓ has mountains of training data
✓ models understand it intuitively
✓ renders straight to pixels
✓ runs basically everywhere
that they understand intuitively, that renders to pixels and can run everywhere.
### The browser turns structure into visuals
A model writes HTML for a heading, grid and chart; the browser renders them as a dashboard without the model placing coordinates.
[4:03](https://www.youtube.com/watch?v=JRTAtZ5iBkU&t=243s) [HTML-like code points through a browser to a Q3 Results layout and bar chart.](https://assets.ai.engineer/sites/aiecode2025/sha256/e3aa4d8e00e3c237cd58564ec43c4d91770653af561f19a6008e7915cfb9114a.webp)
model writes meaning
Q3 Results
…
browser
Q3 Results
✓ charts
✓ layouts
✓ fonts
✦ animation
the model never places a coordinate.
fonts and motion, all of it, for free.
### Same prompt, different medium
The same pelican prompt produces a crude SVG drawing and a detailed HTML illustration of a pelican on a bicycle. The speaker says the HTML structure can be read, themed and edited.
[4:25](https://www.youtube.com/watch?v=JRTAtZ5iBkU&t=265s) [A crude SVG drawing is compared with a detailed HTML illustration of a pelican riding a bicycle.](https://assets.ai.engineer/sites/aiecode2025/sha256/6a48d5badf2cd01da53481d3049f50e3c77fb803dcf561ebf833be1af72ce052.webp)
SAME PROMPT · DIFFERENT MEDIUM
in HTML
→
gemini-1.5-flash, as SVG
as HTML — structure you can read
And you can read and theme and edit every single line of it.
### The reframe
The same Q3 chart can be presented as a slide while edited as HTML, a format the speaker says agents are already good at. It can later be rendered to PDF.
[4:53](https://www.youtube.com/watch?v=JRTAtZ5iBkU&t=293s) [A Q3 Results chart appears under presenting mode beside an empty editing mode panel.](https://assets.ai.engineer/sites/aiecode2025/sha256/d87a61bef6cdec6f7aa179901f6654095ebb879cf96b27d512f356deb8af62d5.webp)
THE REFRAME
PRESENTING MODE
Q3 Results
EDITING MODE
no one in your audience is going to care how you got to the presentation mode.
[5:00](https://www.youtube.com/watch?v=JRTAtZ5iBkU&t=300s) [A Q3 results chart in presenting mode is equated with HTML in editing mode.](https://assets.ai.engineer/sites/aiecode2025/sha256/8daa19c1886f1438ff085266da9b99e1017e0020cdbada4bf994055b38fc9141.webp)
THE REFRAME
PRESENTING MODE
Q3 Results
=
same result
EDITING MODE
HTML
So you can just pick the editing format that the agents are already good at, HTML,
### Slide decks to HTML
The team uses HTML to build slide, board, and sales decks that they present and send out. The examples show text, charts, grids, and quotes across different slide layouts.
[5:16](https://www.youtube.com/watch?v=JRTAtZ5iBkU&t=316s) [Six stylized slide thumbnails show text, charts, a grid, and a quotation.](https://assets.ai.engineer/sites/aiecode2025/sha256/bc548852d539481b73d12f16e1d30de51f309e37b0a71c27a0dd9accd29fb215.webp)
SLIDE DECKS → HTML
“
built in a single prompt.
These are real things that we actually present and send out constantly.
### Docs to HTML
The team uses HTML for docs as well as decks. An engineering spec mockup shows a green note and bar chart as examples of color that follows the brand.
[5:21](https://www.youtube.com/watch?v=JRTAtZ5iBkU&t=321s) [An engineering specification mockup includes a note, bar chart, and implementation heading.](https://assets.ai.engineer/sites/aiecode2025/sha256/d175c423a0b9bf291a48bf7f67cc4cdd2de909dcaf0e30b91ef395198603b790.webp)
DOCS → HTML
Engineering Spec
NOTE
§ Implementation
It gives our docs color and vibrancy, all while following our brand.
### Videos to HTML
The talk itself is rendered with HTML and CSS. The browser mockup pairs the visible scene with its nested divs, including the caption bar.
[5:31](https://www.youtube.com/watch?v=JRTAtZ5iBkU&t=331s) [A browser mockup pairs a rendered talk with an HTML elements panel.](https://assets.ai.engineer/sites/aiecode2025/sha256/e9c552b634f20911c7ebab5c313abf1d387adbe27d4bf9df7a67ded73e666843.webp)
VIDEOS → HTML
a talk, rendered in a browser
(yes — you’re watching one right now)
Elements
…
…
Interface text:
norisessions.com/talk/index.html
### Plain and structured
Plain text gives way to a structured quarterly report with a chart and a +38% YoY callout, illustrating the speaker’s case for adding structure and color.
[5:44](https://www.youtube.com/watch?v=JRTAtZ5iBkU&t=344s) [Dim plain-text lines point to a structured quarterly report with a chart and a growth figure.](https://assets.ai.engineer/sites/aiecode2025/sha256/0c9fb2e2c0027029a9331651b6a4afd58d2a40650a5faea341b5ce3e17408975.webp)
PLAIN
STRUCTURED
Quarterly Report
+38% YoY
but it’s usually the wrong one if you’re actually trying to create something of use.
### A board deck needs context
A polished board deck still needs content. The speaker suggests giving the model access to call transcripts and emails so it can build the deck end to end.
[5:53](https://www.youtube.com/watch?v=JRTAtZ5iBkU&t=353s) [A board deck mockup contains a question mark and magnifying glass, with HTML checked and context questioned.](https://assets.ai.engineer/sites/aiecode2025/sha256/85356ad01fc1978660664c81eb40ee7adca866d760d1e03e8688263bd6be9fce.webp)
Board Deck
??
?
HTML ✓ context ?
I do want to take a quick beat here and point out that a beautiful deck on its own is generally not worth anything.
### From company data to a board deck
Nori Sessions brings company sources into a session to build a board deck, while the user focuses on vision and story. The speaker says he has built entire decks on his phone during his subway commute.
[6:14](https://www.youtube.com/watch?v=JRTAtZ5iBkU&t=374s) [Company data feeds a session that produces a board deck on a phone; the user supplies vision and story.](https://assets.ai.engineer/sites/aiecode2025/sha256/ed34cf455752fdfb47bea82a0952ccb211cf2e63d972dab48d88fff9e736934f.webp)
NORI SESSIONS
transcripts
emails
Workspace
Slack
session
✓ format
✓ layout
✓ charts
🚇 on the commute
Board Deck
you → vision & story
I’ve built entire board decks from my phone on the subway during my commute.
### Think like the model
The speaker argues that giving the model the right language is key, and that HTML is enough for graphics.
[6:47](https://www.youtube.com/watch?v=JRTAtZ5iBkU&t=407s) [Closing takeaway: think like the model and give it the right language.](https://assets.ai.engineer/sites/aiecode2025/sha256/5b54e4bdcf7852c0c2f6bd4c440da38fe79f26f9666ba355ebf37de52a5a1c2a.webp)
Stop thinking like a user.
Think like the model.
Give it the right language.
Given the right language and for graphics, all you need is HTML.
### HTML is All You Need
The talk closes on its central claim: agents can use HTML to make graphics.
[6:51](https://www.youtube.com/watch?v=JRTAtZ5iBkU&t=411s) [Closing card titled HTML is All You Need, for agents to make graphics.](https://assets.ai.engineer/sites/aiecode2025/sha256/ada89e97e8dd83f22a0aae36cda856fce7cefcff75f143e6ce38bb51430eec93.webp)
HTML is All You Need
(for Agents to Make Graphics)
norisessions.com
Created with Nori Agentic
## Full transcript
[0:06](https://www.youtube.com/watch?v=JRTAtZ5iBkU&t=6s) [upbeat music] Hi, I'm Amol, CEO of Nori Agentic. We deploy an AI employee that understands your company, your code, docs, Slack, and other kinds of data.
[0:23](https://www.youtube.com/watch?v=JRTAtZ5iBkU&t=23s) We spend a lot of time thinking about how coding agents really work. Most people think coding agents only write code, but if you ask me, that's just bad marketing.
[0:33](https://www.youtube.com/watch?v=JRTAtZ5iBkU&t=33s) Forget the name for a second. Coding agents can do almost anything. There's just one trick: You have to be able to think like an agent to get it to do what you want it to do.
[0:44](https://www.youtube.com/watch?v=JRTAtZ5iBkU&t=44s) Today, we're gonna talk about how we use coding agents to do something most people think agents are terrible at: make visual artifacts, like slides, docs, and yeah, even video.
[0:59](https://www.youtube.com/watch?v=JRTAtZ5iBkU&t=59s) Every day, the world pours something like thirty-four thousand human years into making slide decks. Most of that time isn't the thinking, it's the fiddling. A deck that takes ten hours should really take about twenty-five minutes once you remove all the formatting and the branding and the moving things around.
[1:18](https://www.youtube.com/watch?v=JRTAtZ5iBkU&t=78s) Say you need to make a slide. What do you do? You open a tool, PowerPoint, Slides, Figma, Canva, and then you start manipulating a canvas. Every one of these tools is built for human hands and human eyes.
[1:33](https://www.youtube.com/watch?v=JRTAtZ5iBkU&t=93s) Click, drag, drop, resize, snap to grid, all motions and patterns that make sense for our geospatial view of the world. There is a data structure underneath, but it's in a format that only the application can read.
[1:47](https://www.youtube.com/watch?v=JRTAtZ5iBkU&t=107s) What happens when you hand these tools to an agent? Well, the output comes out all wrong. Things overlap in weird ways. You can't see the text. There's no alignment.
[1:56](https://www.youtube.com/watch?v=JRTAtZ5iBkU&t=116s) It's just garbage. AI skeptics say that it's not just the tools. Agents fundamentally can't reason about space, and there are whole benchmarks, like ARC-AGI, that are built exactly around that premise.
[2:10](https://www.youtube.com/watch?v=JRTAtZ5iBkU&t=130s) There's a famous little test for this from developer Simon Willison. He asks every new model the same thing: "Can you draw a pelican riding a bicycle?" But there's a trick.
[2:21](https://www.youtube.com/watch?v=JRTAtZ5iBkU&t=141s) The agent is only allowed to use SVG. It's a quick gut check for whether a model can reason about space at all. Here are some examples of what the models actually give you on this test, and yeah, these are pretty bad.
[2:35](https://www.youtube.com/watch?v=JRTAtZ5iBkU&t=155s) Like, genuinely, deeply, really bad. So does that mean it's hopeless? Agents are just doomed to be bad at graphics? No, I don't think so. If you ask me, it's not the model, it's the medium.
[2:49](https://www.youtube.com/watch?v=JRTAtZ5iBkU&t=169s) If I asked you, someone who is presumably human, to handwrite an SVG of a pelican, you wouldn't be able to do that either. SVGs are just a wall of numbers.
[3:00](https://www.youtube.com/watch?v=JRTAtZ5iBkU&t=180s) You can't go from a wall of numbers to a pelican. You just can't see that way. That's just not how people think. We think graphically, so we build tools that let us draw on a canvas.
[3:12](https://www.youtube.com/watch?v=JRTAtZ5iBkU&t=192s) Figma MCPs, PowerPoint CLIs, screenshot and replace loops. What do all of these agent tools have in common? They all approach the problem like a human, but an AI is not a human.
[3:25](https://www.youtube.com/watch?v=JRTAtZ5iBkU&t=205s) Asking an AI to use a canvas is like asking a human to write SVG by hand. It doesn't really make sense. You need to give the AI tools based on how it thinks, not in pixels, in language.
[3:37](https://www.youtube.com/watch?v=JRTAtZ5iBkU&t=217s) Words, tokens, structure, that is its native medium. Imagine a language that's incredible at describing layout, that models have seen and trained on billions of examples of, that they understand intuitively, that renders to pixels and can run everywhere.
[3:57](https://www.youtube.com/watch?v=JRTAtZ5iBkU&t=237s) Oh, right. HTML lets a model think in structure. HTML tags have meanings built into the language, a heading, a chart, a grid, and the browser turns it all into pixels, so the model never actually places a coordinate, and you can get all sorts of visual effects, charts and layouts, fonts and motion, all of it for free.
[4:19](https://www.youtube.com/watch?v=JRTAtZ5iBkU&t=259s) Remember that pelican from earlier? Now ask it to do the same exact task, but in HTML. Same bird, but now it's in a structure that the model can reason about, and you can read and theme and edit every single line of it.
[4:34](https://www.youtube.com/watch?v=JRTAtZ5iBkU&t=274s) I spent my whole life building slide decks with PowerPoint, so I always thought that those two things, slide decks and PowerPoint, were synonyms. But that's just not really true, is it?
[4:44](https://www.youtube.com/watch?v=JRTAtZ5iBkU&t=284s) PowerPoint is a tool that you use to make slide decks. The deck itself, that's just the presentation mode, and as it turns out, no one in your audience is gonna care how you got to the presentation mode.
[4:58](https://www.youtube.com/watch?v=JRTAtZ5iBkU&t=298s) The editing format is totally arbitrary, so you can just pick the editing format that the agents are already good at, HTML, and if you need to, render to a different format, like PDF, later on.
[5:11](https://www.youtube.com/watch?v=JRTAtZ5iBkU&t=311s) We use this HTML trick to build all of our slide decks, our board decks, and our sales decks. These are real things that we actually present and send out constantly.
[5:20](https://www.youtube.com/watch?v=JRTAtZ5iBkU&t=320s) We use it for our docs too. It gives our docs color and vibrancy, all while following our brand. And of course, we also use it to make videos, like this one.
[5:31](https://www.youtube.com/watch?v=JRTAtZ5iBkU&t=331s) What you're watching is just HTML and CSS. It's literally just divs all the way down.
[5:40](https://www.youtube.com/watch?v=JRTAtZ5iBkU&t=340s) Almost everything is better with a little structure and a little bit of color. Plain text is a choice, generally a choice of convenience, but it's usually the wrong one if you're actually trying to create something of use.
[5:53](https://www.youtube.com/watch?v=JRTAtZ5iBkU&t=353s) Now, I do want to take a quick beat here and point out that a beautiful deck on its own is generally not worth anything. You still have to go and get all of that content, all of the things that actually populate that deck, right?
[6:05](https://www.youtube.com/watch?v=JRTAtZ5iBkU&t=365s) Well, again, we can think like the model. If you just give the model access to your data, say, your call transcripts or your emails, you can have the model build the deck end to end.
[6:17](https://www.youtube.com/watch?v=JRTAtZ5iBkU&t=377s) Let your agents do all the grunt work while you focus on vision and story. That's what Nori Sessions lets you do. I've built entire board decks from my phone on the subway during my commute.
[6:29](https://www.youtube.com/watch?v=JRTAtZ5iBkU&t=389s) Why? Because our Nori bot lives in the fabric of our company. Of course, Nori ships with everything you need to make this all work, so don't bother reinventing the wheel.
[6:39](https://www.youtube.com/watch?v=JRTAtZ5iBkU&t=399s) That's my little spiel. Thanks for listening. If you have just one takeaway, it's this: Stop thinking like a user. Think like the model. Give it the right language, and for graphics, all you need is HTML. [upbeat music]