Machine transcription with reviewed terminology and names. Some recognition errors may remain. Timestamps refer to the original livestream.
2:25:00Not all GPUs are deployed the same.
2:25:03Thank you everyone for taking the time to be here today.
2:25:06My name is Oliver Kennon.
2:25:07I'm a research analyst at SemiAnalysis.
2:25:11Time and attention are the most valuable things any of us have, unless of course you're an
2:25:15early stage investor in open AI or Anthropic.
2:25:19With that, let's get into it.
2:25:21Not all GPUs are deployed the same.
2:25:23A GPU falls to the level of the operator.
2:25:27hardware gives you potential.
2:25:30capability is what determines how much useful work you actually are able to
2:25:34deliver.
2:25:34That leads us to the question I will attempt to answer with all of you today.
2:25:38Who can produce the intelligence you need at the lowest cost?
2:25:42Cost matters.
2:25:44today's presentation, I want to show you guys why and how operating capability changes
2:25:50that cost and why it matters in the commodity market that is compute.
2:25:56matters in a commodity market?
2:25:58A lot of tech investors or technologists may not be familiar with this framework, so a
2:26:04little crash course.
2:26:05In a commodity market, producers compete to deliver comparable output.
2:26:09A lower production cost gives more room to compete when prices fall.
2:26:15what a cost curve shows.
2:26:16producers lined up by what they spend to deliver the same usable work.
2:26:20If two producers earn the same price,
2:26:24the one spending less to deliver the work gets to keep more of it.
2:26:27Pretty simple, right?
2:26:30For us, intelligence is the economic output we care about.
2:26:34Eventually, our North Star metric will be price per successfully completed task
2:26:39at the required quality.
2:26:40Unfortunately, we're not quite there yet.
2:26:42That's a pretty hard thing to standardize.
2:26:45today price per token is a useful practical proxy especially for comparable workloads
2:26:51and quality requirements and gets us closer to delivered output much closer than the often quoted
2:26:57all you finance bros out here will have heard this a gpu dollar per hour price or as we view it a cost
2:27:08We view GPU hours as a measure of input, not output, the cost versus price distinction.
2:27:15prices are different from the producer's cost of doing the work.
2:27:22GPU hours are the input, intelligence is the output.
2:27:26On this slide we can visualize the inputs needed to create useful intelligence.
2:27:31We start with hardware and electricity, GPUs, for this presentation.
2:27:36Software and operations can be thought of as a multiplier on those first two inputs,
2:27:41with the end product being useful intelligence.
2:27:47The operator is who chooses and implements the software that serves the model
2:27:50and keeps requests moving through the system.
2:27:54The machines might be available, but you still need someone to make them deliver responses
2:27:58customers can actually use.
2:28:01What matters is how much useful work you get and whether it meets your requirements for
2:28:05the specified task.
2:28:07The conversion can differ with the same kind of chip.
2:28:11Let's look at that in the measured example.
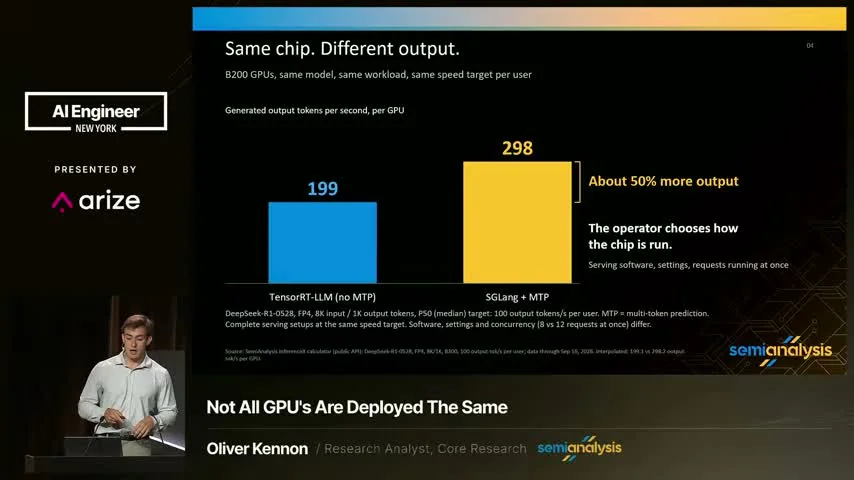
2:28:14Here's a concrete example from our public inference X calculator.
2:28:19You guys can all check it out, semianalysis.com.
2:28:23Both estimates use B200 GPUs serving the same model with roughly 8,000 input tokens and
2:28:301,000 output tokens, a pretty standard ratio.
2:28:33P50 target is 100 output tokens per second for each user.
2:28:37The serving stack is the software handling the model's responses.
2:28:41In the P90 scenario, one of these stacks gives about 200 generated output tokens per second
2:28:47while the other one gives about 300.
2:28:50That's a big difference and comes down to software, settings, and number of requests running.
2:28:56All choices made by the operator.
2:29:02Same chip, same target interactivity, about 50% more output.
2:29:07That's a lot.
2:29:08So what does that mean for the buyer's bill?
2:29:14What does that intelligence actually cost the customer?
2:29:17For this example, let's assume the hourly bill is the same for both deployments and
2:29:22both meet your requirements.
2:29:24At roughly one and a half times the output, your rental spend per acceptable token is
2:29:28proportionally lower.
2:29:30That is to say, the hour buys you more usable and useful output.
2:29:37counts as useful intelligence?
2:29:40intelligence has to do the job you hired it to do.
2:29:42Pretty simple, right?
2:29:43it, the answer needs to be good enough for the task, arrive quickly enough, and be available
2:29:49when you need it. Your information also needs to stay within the access boundaries you've
2:29:53agreed upon, aka it needs to be secure. This is an overlooked requirement that is not
2:30:00captured in a chip's performance metrics, but it is essential for a chip to be usable and useful. In our published security work, we found monitoring access that exposed another customer's logs and metrics. This is a case, and an unfortunately common one at that, where the GPs were fast, in the case I'm referencing really, really fast, which makes the whole thing sadder, and the service still failed horrific.
2:30:25Basically, ensuring cluster security takes ongoing work just as delivering the promised
2:30:30performance does.
2:30:34most cases, it is the operator that owns that responsibility.
2:30:39Someone has to make the system work in production.
2:30:42Suppose a faster serving update becomes available.
2:30:45Someone has to test it on the customer's workload, check whether the output still meets the requirements,
2:30:50and then decide when, where, and how to deploy it.
2:30:54That means checking the actual responses,
2:30:57testing it under load,
2:30:58and keeping a way to return to previous version
2:31:01if the update causes problems once it's deployed.
2:31:05Once it is deployed, someone has to maintain it
2:31:07and respond when issues come up.
2:31:11That work may sit with your provider,
2:31:14your own team, or both.
2:31:17Irregardless, you need to know who's responsible
2:31:19and whether they can actually do it.
2:31:24So how do we assess the operator?
2:31:27Semi-analysis cluster max, we're on version 3.0 at this point, assesses operating capability
2:31:32on managed GPU clusters, a couple hundred growing.
2:31:38Please reach out if you want to be on cluster max 4.0.
2:31:40We look at provisioning, reliability, monitoring, and security.
2:31:44hands-on testing, documentation, and customer feedback help us understand how the service
2:31:50runs, not just on a good day, but also when a machine fails.
2:31:56I want to take the chance to reiterate that cluster max ratings apply to managed clusters,
2:32:02different from bare metal, very different.
2:32:05With bare metal, more operating work usually sits with the customer.
2:32:08Applying a managed service rating there does not automatically cover every product a provider
2:32:13cells. The tiers are relative to peers. A little bit of a tongue twister. I nailed it.
2:32:21And pricing and availability are also important factors in this assessment. These are metrics
2:32:27that do not directly measure token output but are incredibly important. Assessment helps
2:32:36us understand who can deliver. Now we can move on to the next question. What does
2:32:40It's not actually cost to produce useful intelligence.
2:32:42Let's start with a compute bill and other costs that producers still have to cover.
2:32:49price and production costs are different.
2:32:51In our example, the GPU provider rents out hours, the inference producer buys those hours
2:32:58and sells responses.
2:33:00rental bill is revenue to the provider and an input cost to the inference producer.
2:33:04The GPU owner pays for the equipment, power, space and support.
2:33:09inference producer's full cost includes rent,
2:33:11plus whatever software, staff, and other services it pays for beyond that rental.
2:33:16If the inference producer owns its equipment instead,
2:33:19we spread the equipment investment over its working life and add running costs.
2:33:23What the producer charges and what it spends are separate numbers.
2:33:27To understand the cost of useful intelligence,
2:33:29we need to know how much useful work the spending actually produces.
2:33:33Better operations lowers that cost of useful intelligence.
2:33:37The B200 comparison showed why the amount of output matters.
2:33:41More acceptable responses from the same paid hours
2:33:44can spread the inference producer's rental expense over more useful work.
2:33:48For a producer that owns its GPUs,
2:33:50the same logic spreads the equipment investment and running costs over more output.
2:33:55Count all the spending needed to deliver the service over the same period,
2:33:58then divide by the output customers can actually use.
2:34:03That gives us cost for acceptable token for a comparable workload.
2:34:11operations also require investment.
2:34:14and update, deploying it safely, and keeping it working take people and money.
2:34:21extra output has to justify the extra spending.
2:34:25advantage can persist when a team repeats that work as software and workloads change.
2:34:30But one good benchmark doesn't establish it.
2:34:33You have to earn it every single day.
2:34:36Each new workload still needs checking, but a repeatable operating process, from what
2:34:41we've observed, can support a lasting cost advantage and a price advantage, too.
2:34:47Even if you do keep improving, though, your competitors are not sitting still.
2:34:53position on the cost curve is relative.
2:34:55This slide, out of all the slides, should make clear the importance of the commodity
2:35:00framework in all of this.
2:35:01Your position on the cost curve depends on what your competitors can deliver, not just
2:35:05yourself.
2:35:06It's a relative measure.
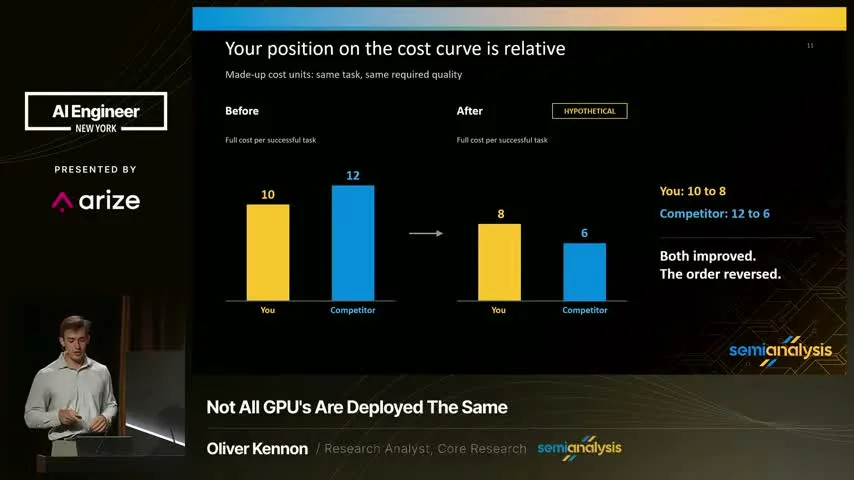
2:35:08Here's a simple hypothetical.
2:35:09We're comparing the same task, the same required quality, using made-up cost units.
2:35:15I like to imagine bars of gold.
2:35:17Your full cost per successful task falls from 10 to 8.
2:35:22In the same period, your competitors fall from 6 to 12.
2:35:28improved.
2:35:29That's awesome.
2:35:30But both of you did.
2:35:31And in this example, you started as the cheaper producer and ended as the more expensive one.
2:35:36That gives the competitor more room to lower its selling price, provided customers find
2:35:41the two services equally acceptable.
2:35:44Getting better does not automatically move you ahead.
2:35:47Instead, applying the commodity framework makes you realize that you have to compare
2:35:50your cost per useful work on a relative basis, comparing your own product with what your
2:35:56competitors can deliver.
2:35:58That comparison can be easy to overlook in moments like today where demand far outstrips
2:36:03supply and will for the foreseeable future.
2:36:07to three years.
2:36:09Visibility, good.
2:36:13can obscure those differences.
2:36:14When demand is strong and supply is constrained, producers with very different costs can find customers.
2:36:21Strong revenue can make those differences feel less urgent.
2:36:24If you're a CEO, why would you focus on your precious time and energy and money,
2:36:28shoring up your spot on the cost curve when you can be building a massive new data center?
2:36:34In moments like this, it's important to step back and have a little perspective,
2:36:38take a little historical perspective.
2:36:40Every commodity in the history of humanity has had swings in supply and demand.
2:36:44Just because we don't see when that will be yet does not mean that this cycle will be
2:36:48any different.
2:36:50Unless you're a total AI maxi, which some of us are, so I'm very open to being wrong.
2:36:54I'm wrong every day.
2:36:57But I would say if you're a business with leverage, you need to be especially conscientious
2:37:02of this.
2:37:02Being proactive with building your cost advantage might not be as sexy as making your top line
2:37:09bigger, but it matters deeply if you want to survive through a business cycle.
2:37:13That's why you want to build your operating capability
2:37:15and cost advantage while you have the opportunity,
2:37:19when the sun is shining, when you can raise capital.
2:37:22They matter even more when customers have more choices to make
2:37:26and prices come under pressure.
2:37:27So how do we make clear what the buyer actually gets?
2:37:32Comparable compute needs clear grades.
2:37:35Now let's look at the compute that an intelligence producer is buying.
2:37:40We've already seen that the same chip
2:37:41can deliver different results depending on how it's operated.
2:37:45And two offers for B200 GPU hours can include different services and leave different operating
2:37:51jobs with the customer.
2:37:53A commodity framework needs a way to describe these differences so buyers know which services
2:37:57they can treat as comparable.
2:37:59That's the job of a grade.
2:38:03grade describes a particular compute service and what its buyers can expect.
2:38:07It doesn't make intelligence interchangeable across every task.
2:38:11Once we've defined that service, we can ask what its rental price tells us.
2:38:18What does a rental price benchmark measure?
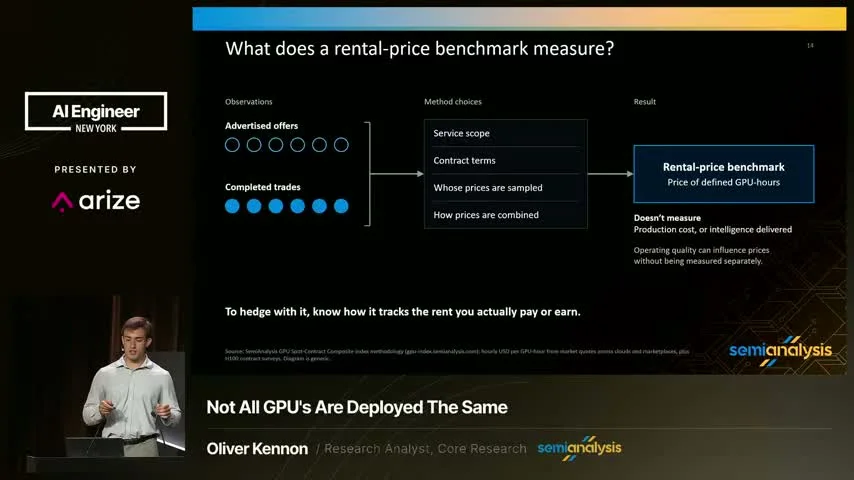
2:38:21A rental price benchmark summarizes the price of GPU hours within its defined market.
2:38:26It isn't the producer's production cost or a measure of intelligence delivered.
2:38:31We need to know where those prices come from.
2:38:33An advertised offer and a completed trade are not the same thing.
2:38:38Service scope, contract terms, whose prices are sampled, and how they're combined all shape that reference point.
2:38:47Operating quality can influence those prices without the index measuring it separately.
2:38:52Running a rental reference doesn't tell you how much useful work your deployment will produce.
2:38:56To use it as a hedge, you need to understand how it tracks the rent you actually pay or earn.
2:39:04What can compute futures hedge?
2:39:07There has been a lot of excitement lately about compute futures.
2:39:10For all of you that don't know, a futures contract sets a standardised term for future
2:39:14delivery or cash settlement.
2:39:16Cash settlement depends on a price reference.
2:39:19Buyers and sellers both face uncertainty about rental prices.
2:39:23Think back to the serving stacks and the monitoring failure.
2:39:26Assessing who runs the system helps describe the service buyers get.
2:39:30That helps us to find grades so buyers know which compute services are comparable.
2:39:35The benchmark then needs to track the rent they actually pay or earn.
2:39:39That's why I make this argument.
2:39:42Rating the operator is an essential building block for building a credible compute futures market.
2:39:48A rating informs that work.
2:39:50It doesn't by itself define a futures grade, establish a sound benchmark,
2:39:54or create enough trading to buy and sell easily.
2:39:57It also doesn't necessarily make a hedge effective.
2:40:00A rental price hedge can help offset rental price changes. It does not fix a failed deployment or ensure that your customer pays.
2:40:10Charging more than the index does not by itself make it a bad hedge. What matters is whether changes in the reference track changes in your rent. Unexpected changes in that relationship leave real price risk.
2:40:22risk, those tools can help you understand what you're buying and manage the rental price
2:40:27risk.
2:40:27For an intelligence producer, rent is one part of the cost.
2:40:31The operator still has to turn that compute into work that the customer can actually use.
2:40:37This brings us full circle.
2:40:45a GPU falls to the level of the operator.
2:40:48So who can produce the intelligence you need at the lowest cost?
2:40:53The producer who can repeatedly meet your requirements at the lowest full cost per successfully completed task.
2:41:00Count everything spent to deliver the service, then divide by the output that the customer can actually use.
2:41:06Operating capability affects both sides of that equation, what you spend, and how much more useful work you can deliver.
2:41:13Also, your position depends on that of your competitors.
2:41:16You can improve and still fall behind if your competitors improve faster than you.
2:41:21That's why understanding the operator matters through the cycle, not just at one point in time.
2:41:27Especially when customers have more choices and prices come under more pressure.
2:41:32In conclusion, if you just walked in and want the TLDR, this is it.
2:41:36A GPU falls to the level of the operator.
2:41:41Help build a better informed compute market.
2:41:43Ladies and gentlemen, thank you so much for your time today.
2:41:45at SemiAnalysis, we know that markets do not become informed and efficient on their own.
2:41:50We seek to be an active, engaged partner in that work. It takes two to tango, though.
2:41:56Ideally, more than two, actually. If you'd like to partner with us, contribute, or join the team,
2:42:02we would love to hear from you. We are always hiring great people. Please reach out.
2:42:08If this resonated, please go ahead and email sales at semianalysis.com
2:42:13for partnership opportunities.
2:42:15And if you're interested in potentially joining the team,
2:42:19my email is kenin at semianalysis.com, K-E-N-N-O-N.
2:42:23Thank you all for listening,
2:42:25and have a fantastic rest of your day.
2:42:28Thank you.