October 14, 2026Online track5 min read

Tokens Are the Cheap Part

A rising AI bill can accompany a falling cost of delivery. Steve Jamison combines salary and token spending to examine the cost of a merged pull request—and checks whether the apparent gains hide smaller changes or worse quality.

Steve JamisonJellyfishAI Research and Engineering Leader

From the conference livestream · 4:43:49–5:01:14 on YouTube. The player starts and stops at this session’s boundaries.

4:43:49 ↗

Two growth rates cannot settle the budget

AI spending is up 60-fold, while merged pull requests per engineer are up 43%. Steve Jamison opens with those two year-over-year changes in Jellyfish’s engineering-workflow and AI-telemetry data. Neither tells an engineering leader whether the next dollar of AI spending is worthwhile.

The finance team can see a much larger bill. The engineering team can point to more merged work. Comparing the percentages is tempting, but they measure different things, and the spending figure leaves out the largest cost involved in producing the code: developer salaries.

Capping token use might stop waste. It might also remove a tool that saves expensive human time. Another company’s bill offers little guidance if its team, workload, and results differ from yours.

Jamison proposes putting both kinds of spending into the same calculation. For a reporting period, add developer salary costs and AI costs, then divide by the number of merged pull requests. He calls this the intelligence cost of a merged PR. The question becomes whether the combined cost of delivering a unit of reviewed code is rising or falling. The reframing begins at 4:46:44.

4:47:18 ↗

Count the human work as well as the tokens

In the August 2026 breakdown Jamison presents, AI accounts for 2.5% of that combined cost. Human salary accounts for the other 97.5%. A dramatic increase in the small component can coexist with a reduction in the total cost per PR if the same salaried team merges more work.
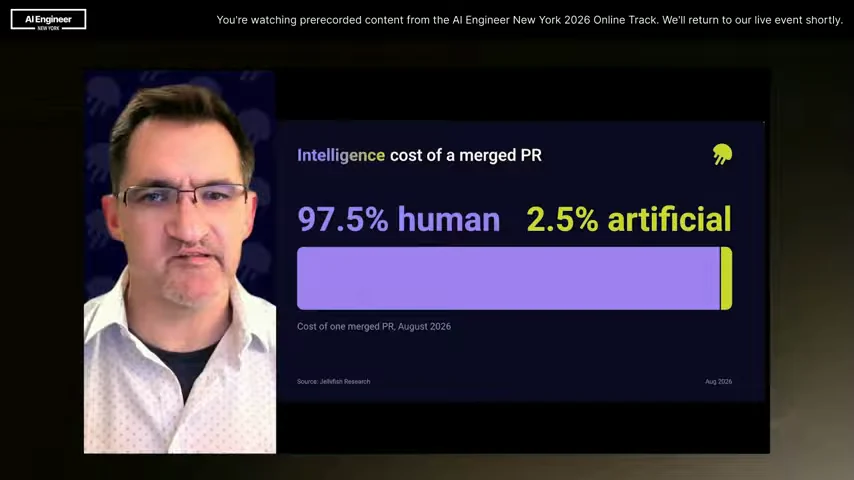
A bar divides the August 2026 intelligence cost of a merged pull request into 97.5% human and 2.5% artificial.

At 4:47:35, the relative sizes explain why the token bill alone can mislead. The percentages describe Jellyfish’s presented data, not every engineering organization.

The calculation uses merged PRs, rather than PRs merely opened. That includes the time spent getting work through review and at least some quality gates. It does not turn PR count into a direct measure of customer value, but it gets closer to delivered work than counting generated code alone.

Across the study’s one-year comparison, the reported cost per merged PR fell 26%, even with the 60-fold increase in AI costs. Jamison says 83% of the companies studied saw a decline. His explanation is that throughput increased fast enough to spread salary across more merged changes, outweighing the added AI spending.

The useful comparison is therefore a ratio with consistent scope: combined salary and AI costs divided by merged PRs for the same team and period. Keep the bill and throughput alongside it so a change in the ratio remains explainable.

4:48:46 ↗

Heavy users improved more, with diminishing returns

Jellyfish divides companies into five groups by token use. In the lightest fifth, AI represents about 0.3% of the cost per PR; in the heaviest fifth, it represents 8.5%. Jamison reports roughly 60 million tokens per developer per month at the light end and 2.5 billion at the heavy end.

All five groups increased throughput. The lower four groups improved by around 40%, while the heaviest group increased merged PRs per developer by 67%. The corresponding cost per PR fell by roughly a quarter in the lower groups and 32% in the heaviest group.
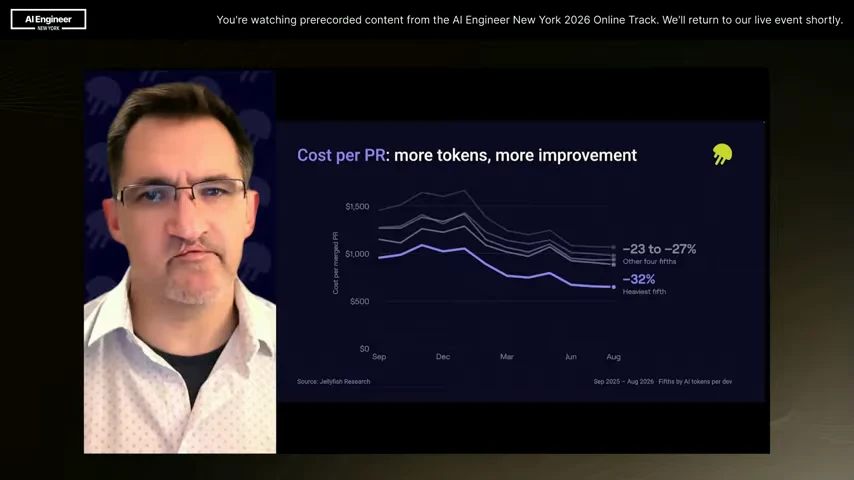
Cost per merged pull request declines across all five token-usage groups fromSeptember2025 toAugust 2026, with the heaviest fifth showing a 32% decline.

The comparison at 4:50:25 shows a 23–27% decline for the other four fifths and 32% for the heaviest fifth. The groups differ in token use; this observational comparison does not isolate spending from every other difference between their workflows.

Jamison also shows diminishing returns. Initial increases in token use accompany a steep reduction in cost per PR; the curve then flattens. A flatter curve still leaves room for improvement. In the comparison he presents, the top tenth of company-months by token use consumed eight times as many tokens as the median and had a 25% lower cost per PR.

That does not imply unlimited spending is efficient. It suggests that the point where additional tokens stop paying for themselves had not been reached by much of the observed population. Whether a particular team is near that point requires its own output and cost data.

A developer-level analysis provides another view. Comparing heavier agent-skill weeks with the same developers’ weeks without skills, Jamison reports about twice the token spending, 27% more merged PRs, and an 18% lower combined cost per PR. The displayed sample spans September 2025 through July 2026 and about 690,000 developer-weeks. Comparing people with themselves reduces some differences between developers; it still leaves questions about how their tasks and workflows changed between weeks.

4:53:35 ↗

Check whether the output got worse—or just smaller

Two objections matter before treating cheaper PRs as a win. The team might be merging more mistakes. Or it might be dividing the same work into smaller PRs.

For the first, Jamison examines reverts: merged changes that undo an earlier change. The heaviest token-use group started with the lowest revert rate, before much of the token growth. Rates later declined slightly across the groups, but he explicitly says the changes are too small relative to the noise to count as evidence of improvement.
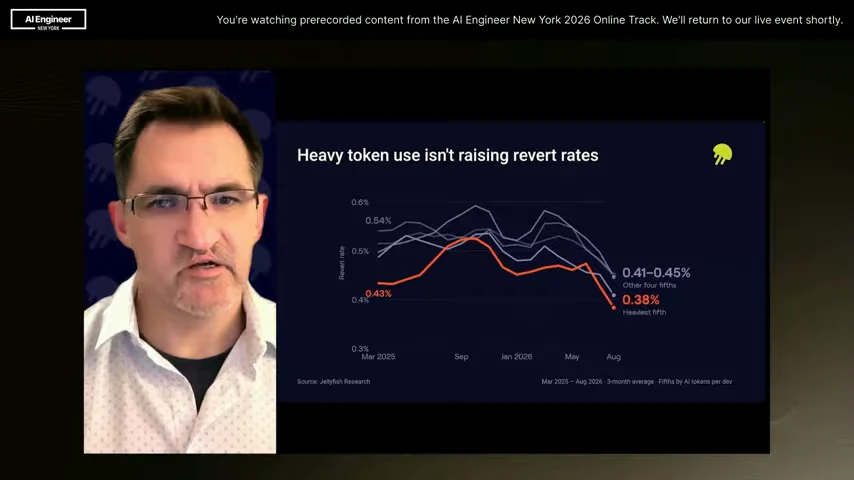
Revert-rate lines remain close across token-usage groups, with the heaviest group starting and ending lower.

At 4:54:25, the chart uses a three-month average from March 2025 through August 2026. Jamison reads it as an absence of a concerning rise in reverts, not proof that code quality improved.

A revert is only one quality signal. Problems can survive without a rollback, and a PR can pass review without being valuable. Jamison’s operational recommendation is to keep quality measures next to cost and throughput, so a favorable ratio cannot hide damage elsewhere.

The smaller-PR explanation also does not fit the presented data: lines of code per PR increased. Jamison offers several possible reasons, including generated verbosity, unnecessary tests, and developers expanding a change because another edge case is only a prompt away. He does not settle which explanation dominates.

The increase rules out smaller PRs as the simple explanation for this throughput pattern. It also raises its own question about review load. More code is not automatically more useful work.

4:56:13 ↗

Budget against delivery cost

Return to the original comparison: 60 times the AI spend and 43% more output. Add the salary cost, and the result in Jellyfish’s study is a 26% lower cost per merged PR. That is the number Jamison wants engineering leaders to bring into a budget discussion.

Keep three views together each month:

  • The AI bill: how much the team spends, including runaway jobs that should be stopped.
  • Merged PRs per engineer: how delivery throughput changes as the workflow changes.
  • Combined cost per merged PR: whether the extra spending is outweighed by lower human cost per delivered change, with quality measures beside it.

This framing also changes how to evaluate optimization projects. A model router, a custom post-trained model, or a token limit might reduce the bill. Helping engineers use agents more effectively might improve throughput enough to save more overall. The comparison needs both sides of the cost equation.

Jamison’s conclusion for the range of organizations he observes is to keep investing while measuring the return. The token bill tells the team what it bought. The combined delivery cost helps it judge whether that purchase made the work cheaper. Watch the budgeting discussion at 4:58:48.

Further reading

Full transcript 203 timestamped passages

Machine transcription with reviewed terminology and names. Some recognition errors may remain. Timestamps refer to the original livestream.

4:43:49Hi, I'm Steve Jamison, AI Research and Engineering Leader at Jellyfish.

4:43:54I'm here to show you why tokens are the cheap part.

4:43:57The research that I'll present is drawn from the Jellyfish platform,

4:44:00the industry's largest set of engineering workflow data joined to AI telemetry data.

4:44:07It's no secret that AI costs are climbing.

4:44:10They're up 60x from this time last year.

4:44:13The use cases are wide and varied.

4:44:16The models and harnesses are getting much better.

4:44:18The implications are exciting.

4:44:20But discussions around budget and spend are not as much fun.

4:44:25These conversations involve your peers and senior leadership and the board.

4:44:28not always the easiest audiences, especially when you don't have the right data.

4:44:34And it's real money these days. Output is up too. Merged PRs per engineer are up 43% over the same

4:44:43one-year horizon. This is phenomenal. We've not seen productivity inputs like this,

4:44:49especially on this timescale. There's plenty of research and anecdotal data to know

4:44:55that AI and agentic coding are driving these throughput gains.

4:44:59Heck, even our charts show the correlation.

4:45:01Notice where the inflection points are.

4:45:04AI spend increased in early 2026

4:45:07when throughput gains start a steady increase of their own.

4:45:12There's a tension with these two numbers, though.

4:45:14How do you reconcile them?

4:45:16Spend is up 60x.

4:45:18Throughput is also up 43%.

4:45:20Is that good? Bad?

4:45:2343% is a big number.

4:45:25But so is 60x. How do you know if you're spending enough? Is there more productivity gain locked behind a checkbook? Should we increase spend 50% 2x more? Or how do you know if you spent too much?

4:45:44I'm sure many of you have felt the tension here.

4:45:46The CFO or board are asking for the receipts of the spend.

4:45:50Can you show them?

4:45:52Will merged PRs are up 43% satisfy them?

4:45:56Also, what happens if you cap use and spend?

4:46:01Are you stopping from setting tokens on fire?

4:46:04Or are you stumping further efficiency gains?

4:46:07You can ask peers at other companies what they're paying.

4:46:10For many, it's still a moving target, though.

4:46:13But how do you equate that to your org?

4:46:17Surely, just comparing their bill to yours isn't adequate.

4:46:20We've heard the reports of companies spending $100K, $500K, even millions on AI,

4:46:30setting, then resetting their AI budgets as reality sets in.

4:46:34Ultimately, these two numbers can't tell the story.

4:46:38And even together, they missed the biggest line on the cost side.

4:46:44These two numbers leave out the biggest cost of all, developer salary.

4:46:49AI is making developers more productive on a scale we haven't seen before.

4:46:54It isn't just another tool, it's intelligence.

4:46:57This intelligence dramatically changes how much each dev can produce.

4:47:02That's why we need to think about its cost differently.

4:47:05Not often the side is overhead, but it's part of what it takes to produce each PR.

4:47:11We're going to call this intelligence costs of a PR.

4:47:18What you pay your engineers plus what you pay for AI, put them together in one cost bucket.

4:47:26AI is about 2.5% of the cost to produce another unit of merged code.

4:47:33Salary is the other 97.5%.

4:47:37This is in line with other reported figures, and this data is from August 2026.

4:47:44Here, tokens are the cheap part. But that's current relative costs, not dollars. Let's

4:47:52look at what happened to the cost of merged PR over the last year.

4:48:02The dollar cost of a merged PR fell 26% over the last year.

4:48:07Not PRs created, but PRs merged.

4:48:11Review time has factored in, and some level of quality gates has been cleared.

4:48:16That decline in cost per merged PR includes a 60x increase in AI costs over the same time frame.

4:48:23The change is nearly universal, too.

4:48:2583% of the companies we studied showed a drop in cost per PR.

4:48:30What does this tell us?

4:48:32The additional throughput gains are spreading salary thinner across PRs,

4:48:39and this is happening faster than the AI costs are increasing.

4:48:46What's the range in token spend?

4:48:48We ranked companies by token usage, then grouped them into quintiles or fifths.

4:48:55The range here is quite large. The lightest group, about 0.3% of the cost of a PR is AI. This represents about 60 million tokens per dev per month.

4:49:11The top 20% of AI spend per dev, we're going to call the heaviest spend group.

4:49:19There, 8.5% of the PR cost is AI.

4:49:23This represents about 2.5 billion tokens per dev per month,

4:49:28about two orders of magnitude more than the lightest group.

4:49:33We'll use these groups on the next slides to see how token spend influences other metrics.

4:49:40First, PR throughput measured as merged PRs per dev, split by the same AI spend quintiles on the previous slide.

4:49:49The bottom four-fifths of spenders sell PR throughput gains of around 40%, give or take.

4:49:58But the heavy spend group

4:50:00improved more at a 67% increase.

4:50:03More AI spend led to more throughput gains.

4:50:11let's look at the cost per PR.

4:50:13Positive results are seen again across the board.

4:50:17Cost per PR is dropping for all AI usage groups.

4:50:21However, again, the heaviest fifth, so the companies that spent the most, improved the most.

4:50:30They saw a cost per PR decrease of 32% over the last year.

4:50:37The other four groups saw about a 25% decrease in cost per PR.

4:50:44Investing and spending more on AI fueled more of an improvement in cost per PR.

4:50:50compared to peers who leaned in less.

4:50:53So we saw that the same as we saw in the population average,

4:51:00cost per PR changes are driven largely by PR throughput, not by AI spend.

4:51:06The heavy spenders experience PR throughput gains of 67%

4:51:11compared to about 40-ish percent for their peers.

4:51:15Spreading the same salary across more PRs in the month

4:51:19has more of an effect than the rising AI costs,

4:51:23because tokens are the cheap part.

4:51:28This is not to say that orgs should light tokens on fire

4:51:33and spend with a banding.

4:51:34Here, we're looking at tokens used on the horizontal axis

4:51:37and cost per PR on the vertical axis.

4:51:40There's a steep drop at the beginning

4:51:42where relative small AI spend results in large gains initially.

4:51:47As token usage increases, the cost per PR improvement decreases.

4:51:53This is diminishing returns.

4:51:55I want to stress, though, diminishing returns is not the same as no returns.

4:52:02We're seeing that the top 10% are spending 8x the tokens compared to the median

4:52:11and achieving a 25% lower cost per PR.

4:52:17There will be a time when tokens aren't the cheap part, but by and large, for most companies out in the wild, we're not close to that threshold.

4:52:28More tokens leads to more PRs, which leads to a lower cost of delivery.

4:52:41So far, we've talked about companies.

4:52:44Next, I'd like to take a tangent and talk about a study we did with developers.

4:52:50Here we looked at developer weeks with heavy token use compared to the same developer weeks with lower token use.

4:53:02Here we saw the same phenomenon just at the individual level.

4:53:07Compare each developer's heavy agent skill weeks with their own weeks without skills.

4:53:15They spend about twice as much on tokens, merge 27% more PRs, and reach PR costs about 18% less once salary and tokens are counted together.

4:53:35there are two fair curiosities i get when i talk about this work first does faster work

4:53:43result in worse work and second are the more prs

4:53:50the throughput gains that we're seeing are they being driven by smaller chunks of work

4:53:58First curiosity is cheaper, faster work, worse work.

4:54:03If AI makes PRs faster and cheaper, are we just shipping more mistakes?

4:54:08One proxy for this is reverts. Merge PRs that undo an earlier PR.

4:54:15The heaviest fifth started lowest before most of the token growth.

4:54:20And revert rates dropped slightly for every group.

4:54:24though these deltas are just slightly below the noise in the data.

4:54:28It's not evidence of improvement here.

4:54:32However, more importantly, we're not seeing any worrying signs of rampant or severe quality issues

4:54:40with higher token spends and faster PR throughput.

4:54:46it. The second curiosity, is throughput driven by smaller PRs? And this is demonstrably no,

4:54:58not smaller PRs. In fact, AI is driving an increase in lines of code generated per PR.

4:55:07This is no surprise to the devs in the room. Raise your hand if you've rolled your eyes at

4:55:13for both unnecessary inline AI comments,

4:55:17or a file full of mostly irrelevant tests.

4:55:20Gen AI likes to generate code.

4:55:25Also, the bar to create is low for devs,

4:55:27and there's a pool to do more per PR

4:55:30instead of spending up another ticket.

4:55:32It's just one, maybe two prompts,

4:55:34and I'll handle this edge case,

4:55:36or I can combine this and that element.

4:55:38Fewer PRs to wrangle.

4:55:40This doesn't mesh well with the PR review stress

4:55:43folks are feeling these days though.

4:55:48Also, AI is just becoming more capable,

4:55:52so we're getting more ambitious.

4:55:54It is beyond this talk to dig into what's actually driving

4:55:58those level of lines of code changes.

4:56:02However, the increase in PR throughput

4:56:05is not coming from smaller PRs.

4:56:08This is intuitive for most, but it's still good to verify.

4:56:13Back to the opening question.

4:56:16Is 60x more spend worth 43% more output?

4:56:21You can't tell in isolation.

4:56:23You should track both.

4:56:25They are important numbers, but they're supporting metrics.

4:56:29AI spend per PR is the intelligence that you're buying as a resource to help make your devs go faster.

4:56:38PRs per engineer is what you're getting with that spend.

4:56:43However, looking at those hides the trade-off.

4:56:51But put salary into the equation and take the ratio of cost to throughput.

4:56:56And there you get your answer.

4:56:58Cost per PR is down 26% over that same time period.

4:57:04It's clear AI is driving cost efficiencies despite the increasing bills.

4:57:13and the AI spend needed to get those efficiencies is small, relatively speaking.

4:57:21AI is still a sliver of what a PR costs, 2.5% on average,

4:57:28under 10% for the heavy spender group.

4:57:31Tokens are the cheap part.

4:57:33In the range that we see, more spend kept paying.

4:57:38heavier token users saw 67% PR throughput gain compared to 40% for their lower spend peers.

4:57:47This drove cost per PR down 32% compared to about 25% for the lower spend peers.

4:57:55Looking at the PR cost to token ratio curve,

4:57:59The top 10% of company months by token usage resulted in 8x the tokens, but 25% lower cost per PR compared to the median.

4:58:14AI is making developers more productive on a scale we haven't seen before.

4:58:20It isn't just another tool, it is intelligence, which changes how much each dev can produce.

4:58:28That's why we need to think about its costs differently.

4:58:30Not off to the side as overhead, but as part of what it takes to produce each PR.

4:58:36You need to add the AI spend and the human spend, the human salary spend, together to calculate your real costs per PR.

4:58:48This isn't to say spend frivolously.

4:58:52Sure, you should watch for runaway jobs.

4:58:56You should track your AI spend.

4:58:58I'm not saying don't look at how much AI spend is going in each PR.

4:59:05I'm saying don't let that be your driving metric.

4:59:08A new framing might steer how and when you think about other investments,

4:59:14like integrating model routers, post-training your own model,

4:59:18implementing token limits, et cetera.

4:59:22Will you get more efficiencies out of trying to control AI costs or by continuing to invest in things that increase throughput, like more AI enablement?

4:59:33Either way, track the total intelligence costs, human plus artificial, per PR every month next to that AI bill and next to the PR throughput.

4:59:45How are you trending? Is throughput continuing to improve?

4:59:49What about those cost efficiencies, the cost to deliver?

4:59:53Watch reverts and quality metrics beside all of this as a counterweight.

4:59:59We don't

5:00:00AI slot mucking up the gears.

5:00:02So heading into budget season, bring cost per PR to the table. Not just your token bill, not just the throughput bump.

5:00:12The bill tells you what you spent. Cost per PR tells you whether it worked.

5:00:18And right now, for most companies, it says keep investing.

5:00:23Tokens are the cheap part to get efficiency gains.

5:00:30Well done. You made it to the end.

5:00:33Here's how you can stay up to date with our latest research, which again draws from the largest engineering workflow and AI telemetry data set in the industry.

5:00:42You can follow me on LinkedIn, my colleagues, or Jellyfish.

5:00:48subscribe to our sub stack,

5:00:50or you can check out our Jellyfish blog on the website.

5:00:54If you want help tracking your org's engineering workflow

5:00:57and AI effectiveness, including cost per merged PR,

5:01:02go to our website and book a demo or reach out to me

5:01:05and I'll get you connected to the right folks.

5:01:08Again, I'm Steve Jamison,

5:01:10AI research and engineering leader at Jellyfish.

5:01:12Thanks for watching.

5:01:14Cheers.